01Free · available
Luxury retail
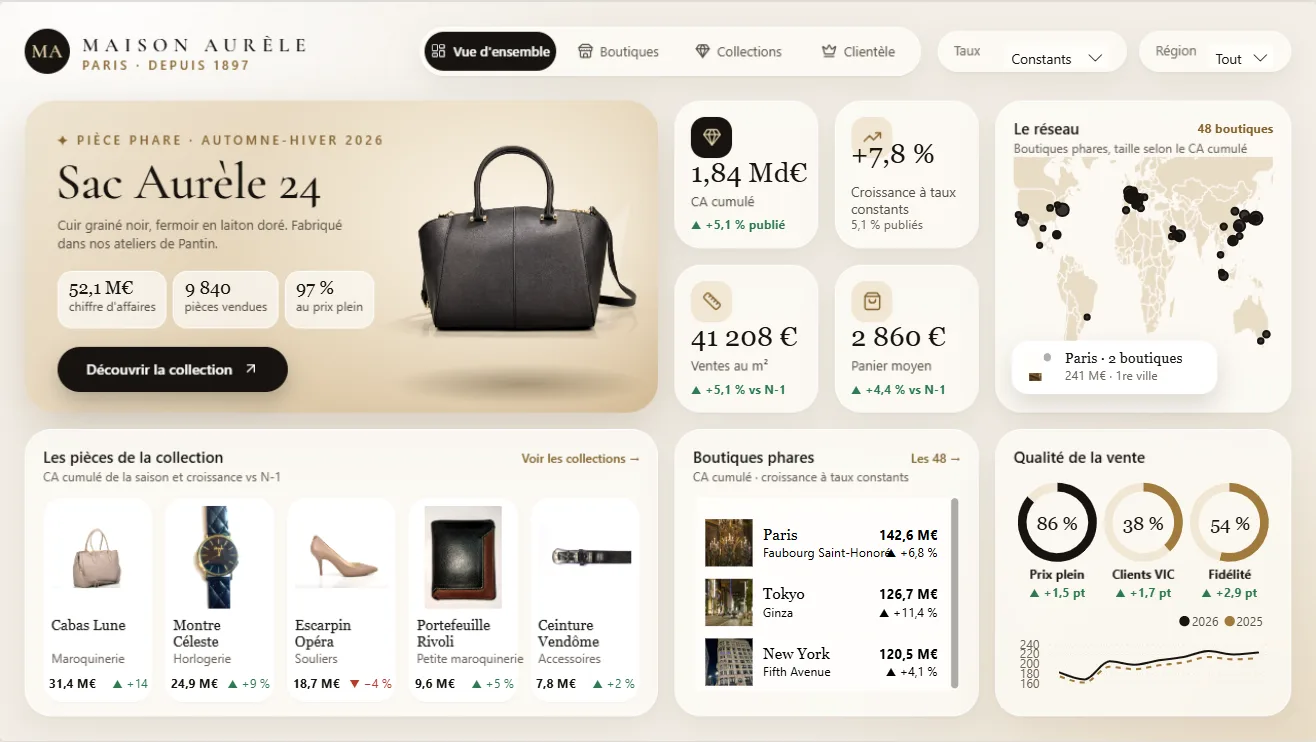
Boutique performance for a fashion or leather-goods house.
- Sales per m²
- Full-price sell-through
- VIC share
Same data. Same model. A report people actually read.
I audit and redesign Power BI reports so decisions jump off the page, in native Power BI your team can maintain.
/01Sounds familiar?
It's rarely Power BI itself. It's almost always one of these four.
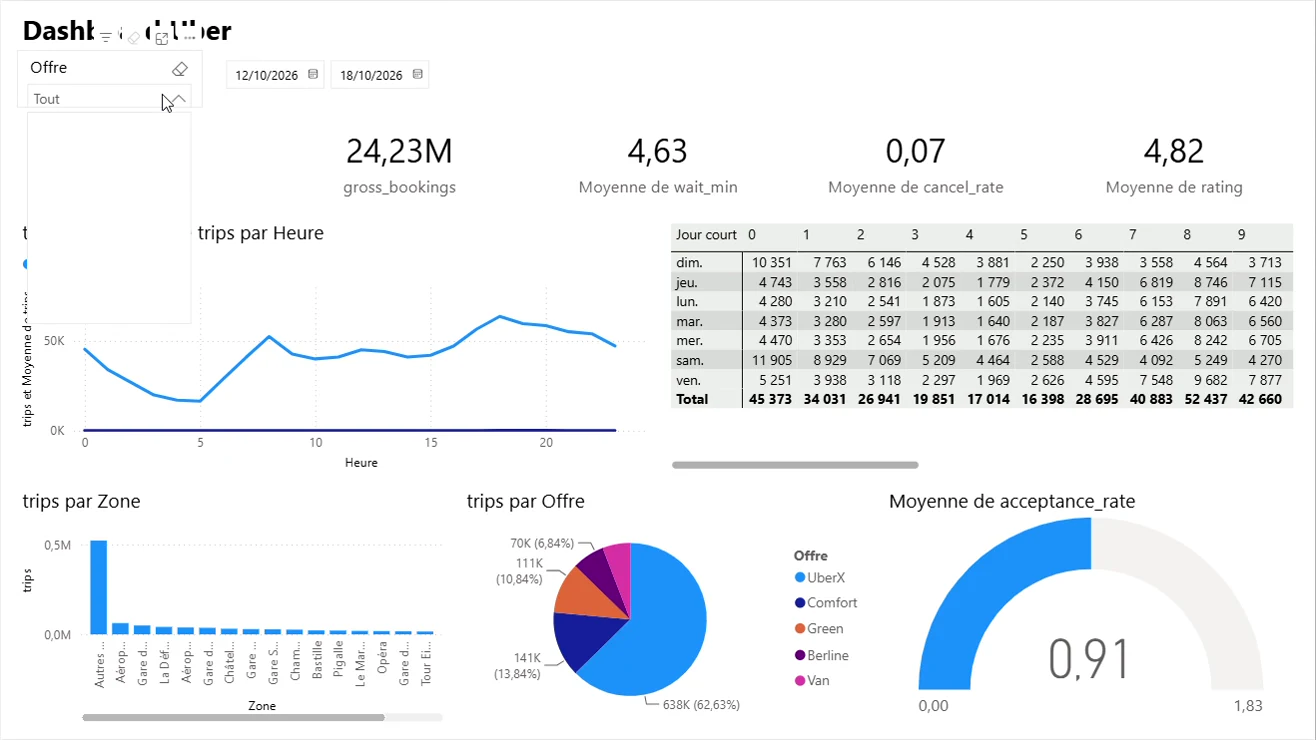
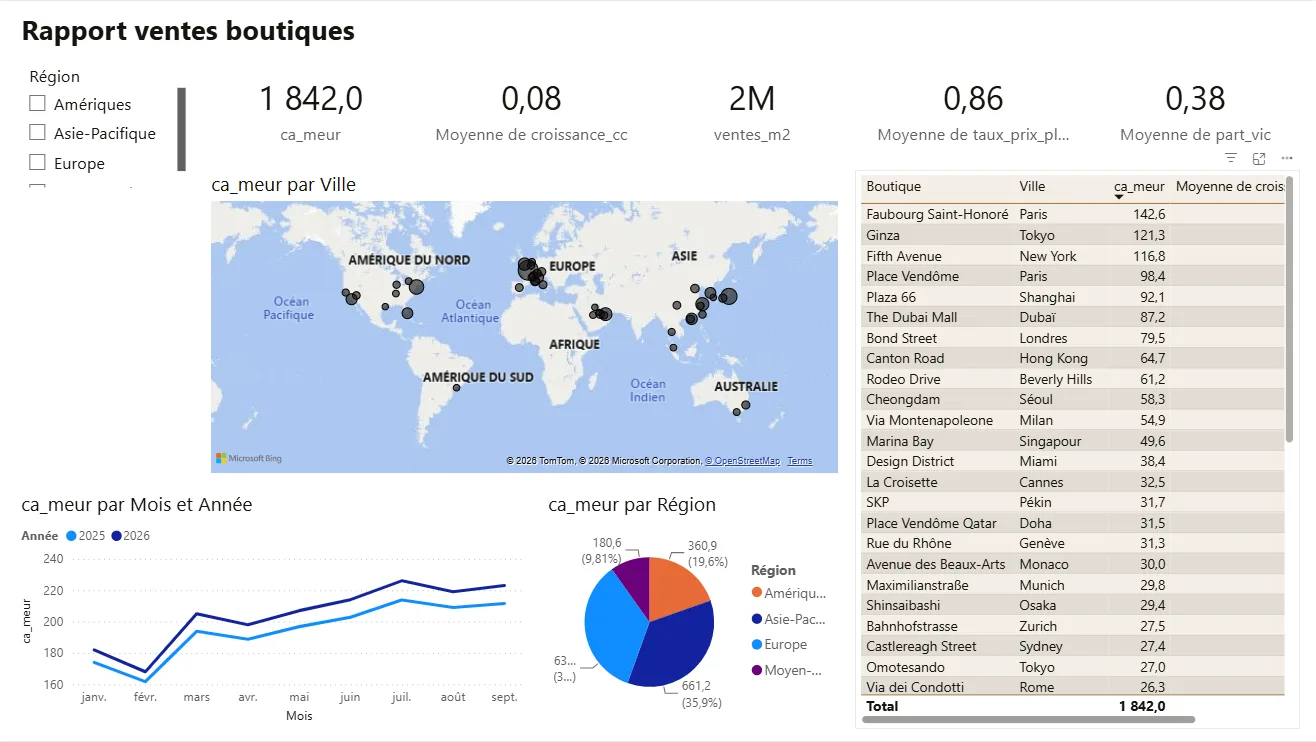
“Moyenne de cancel_rate”: the reader has to decode the report before reading it.
0,07 instead of 6.8 %: no format, no unit, no comparison to last week or to a target.
Pages tucked away in tiny grey tabs that nobody clicks.
Pie charts with ten slices and gauges on a meaningless scale.
/02The cost of an unread report
Every unread report is a decision made somewhere else, usually in a spreadsheet.
/03The glow-up, live
The same Power BI report, the same data. Each scroll step fixes one thing a reader trips over.
/04Case study
Unofficial concept on demo data: an 11-page Power BI report built from scratch, with app-like navigation, a live city map, tooltips and alerts.
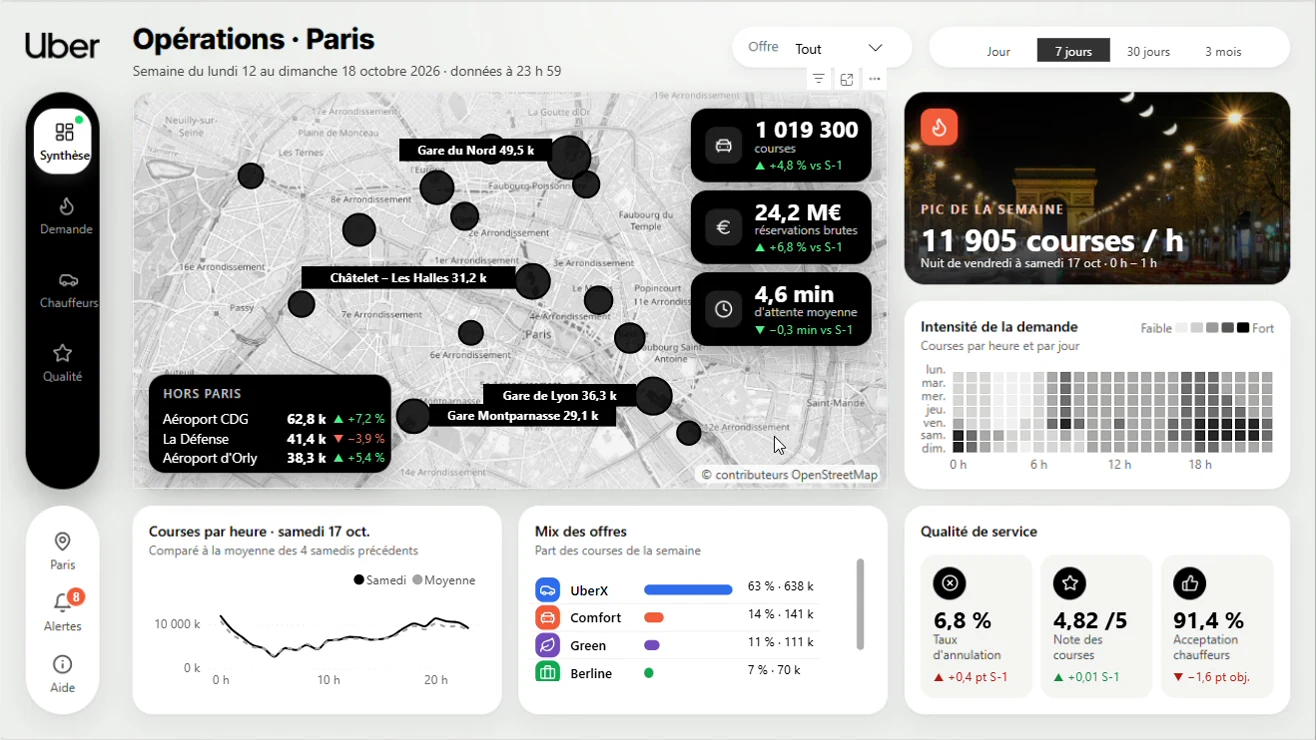
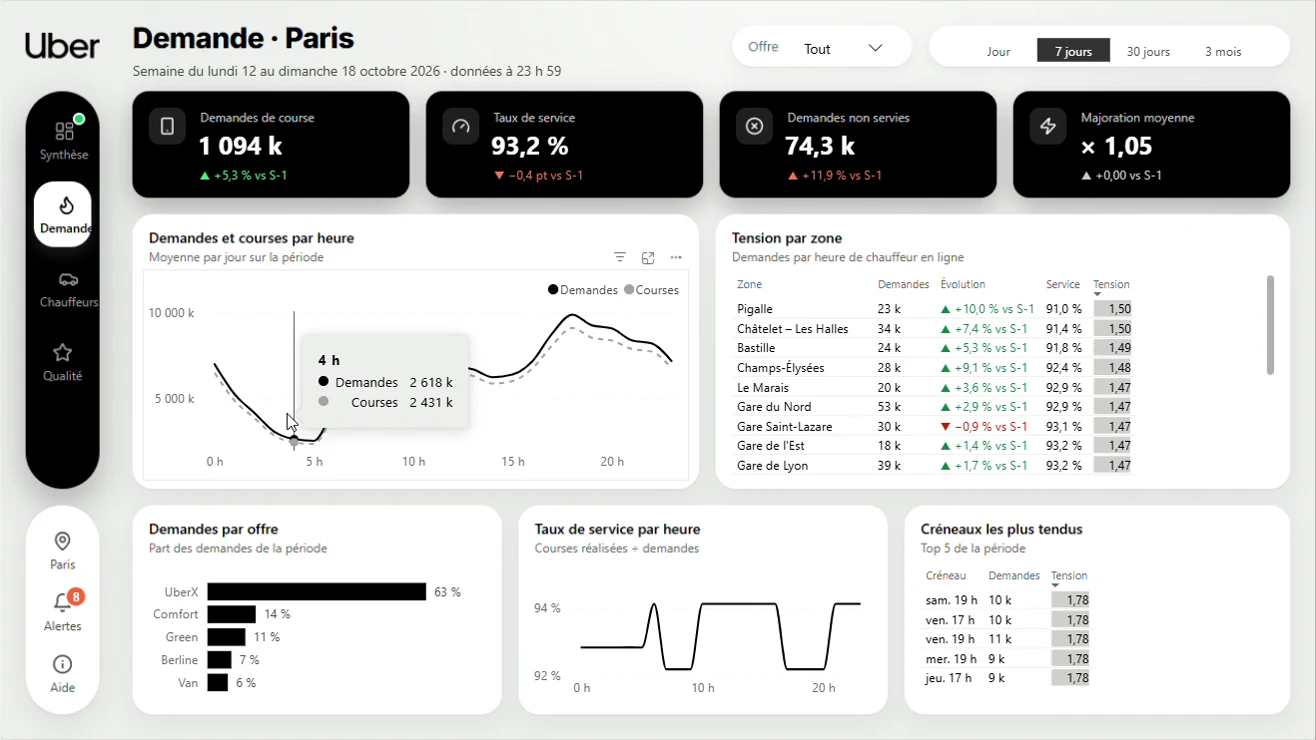
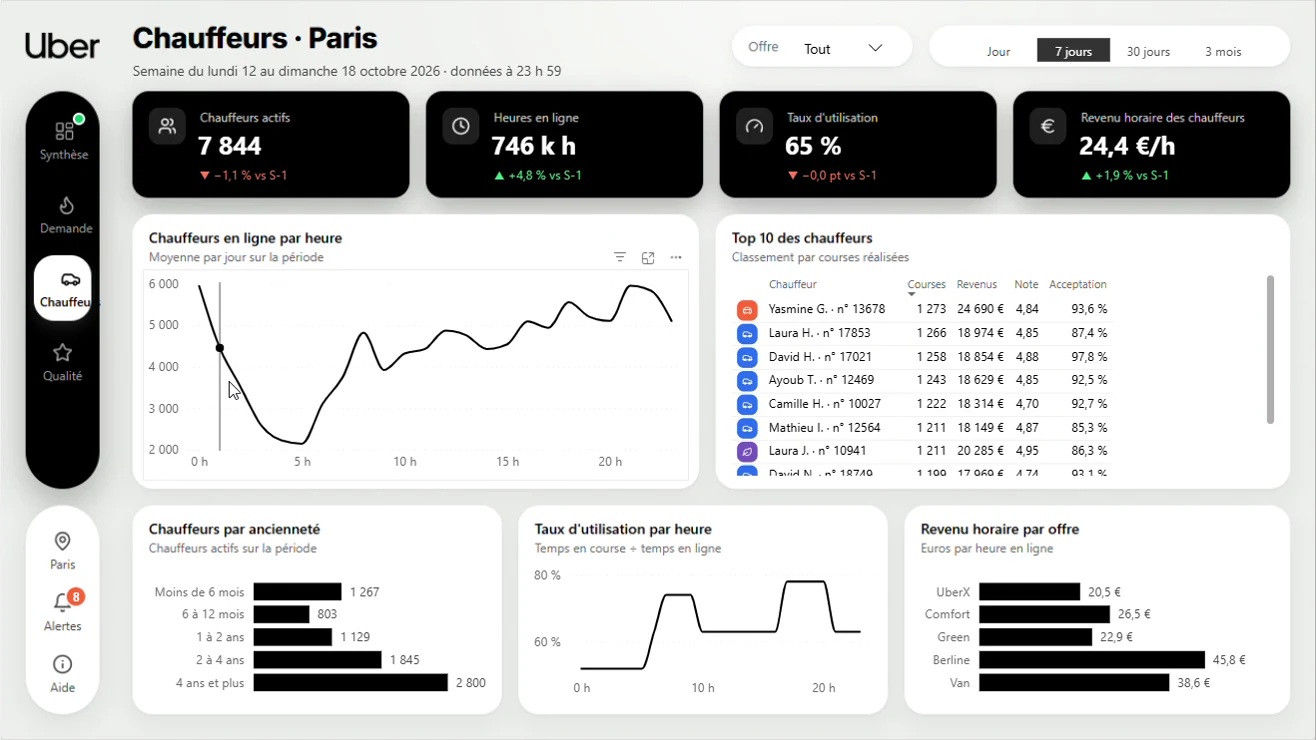
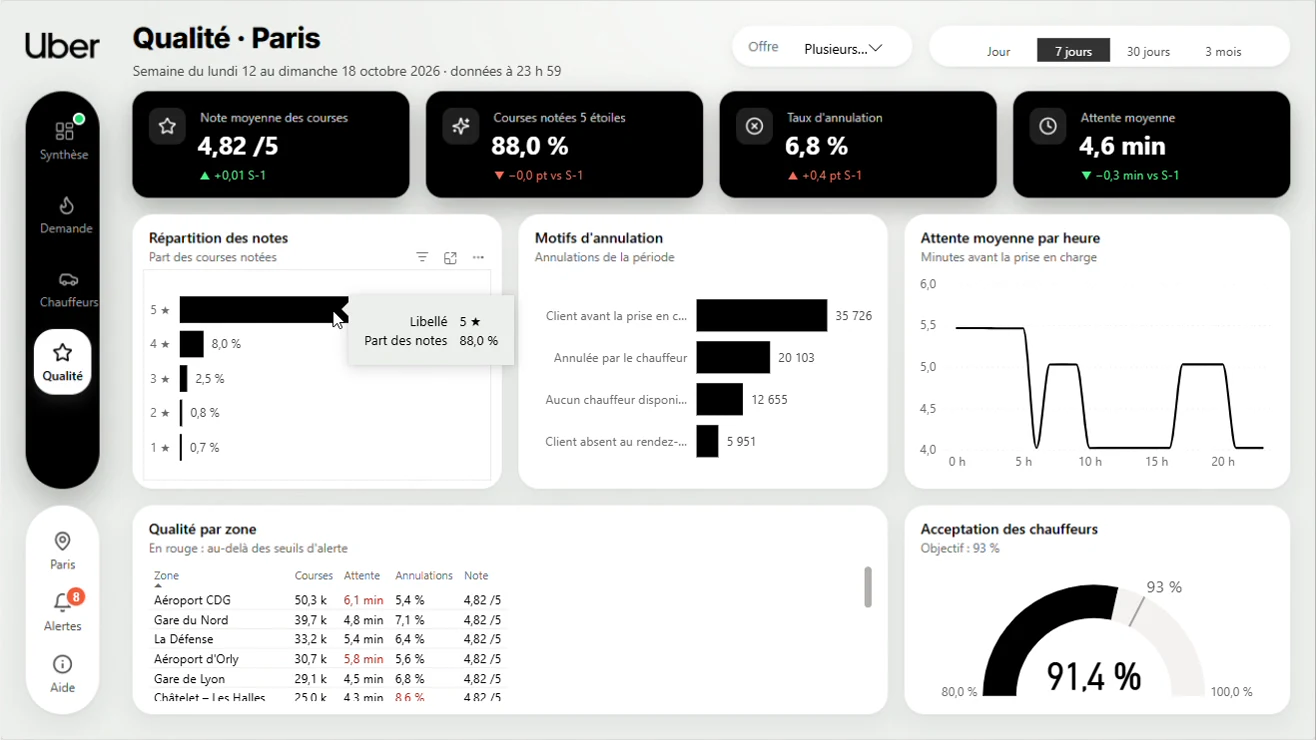
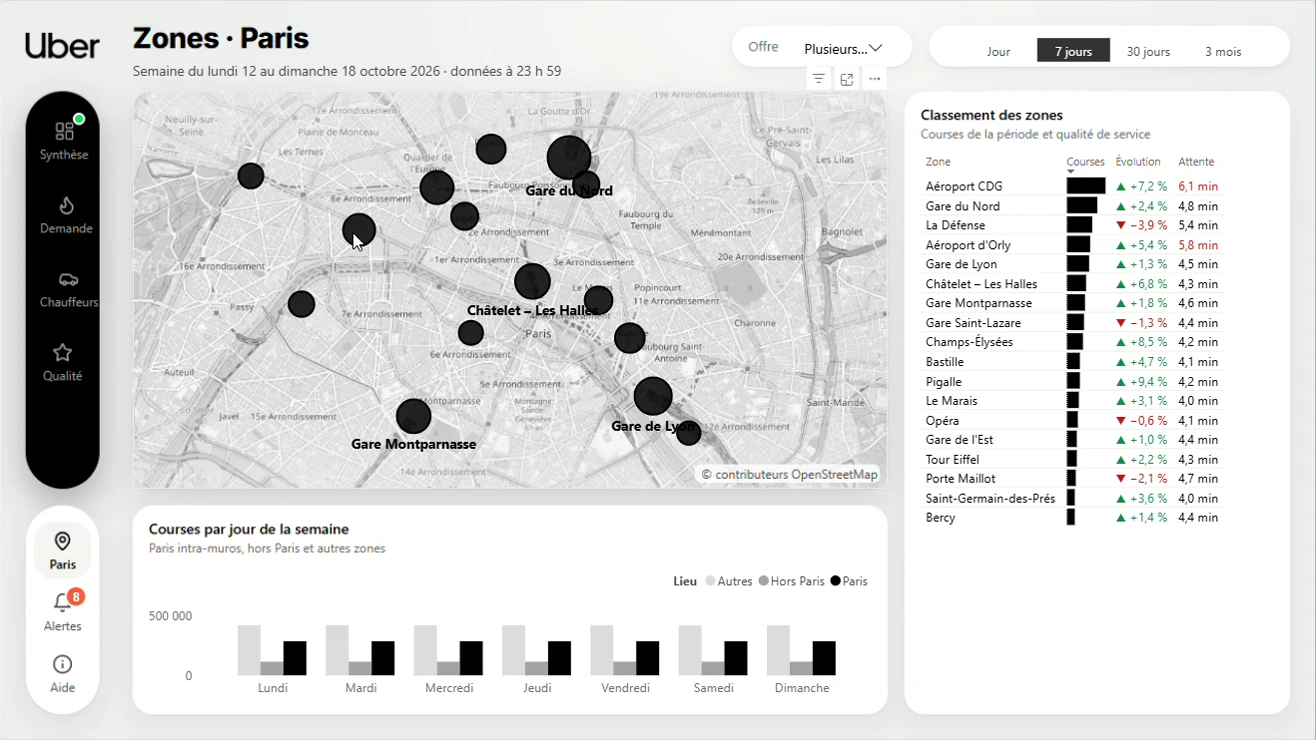
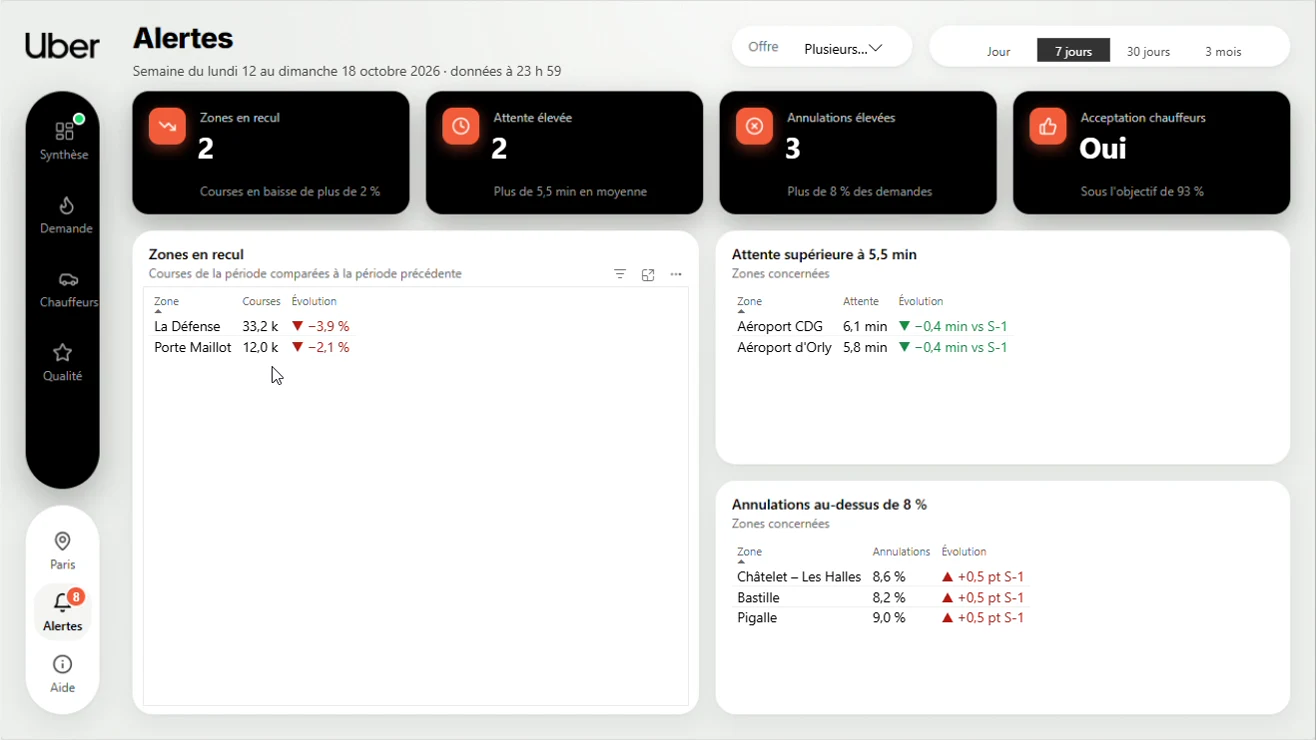
Uber is a trademark of Uber Technologies, Inc. Unofficial concept with fictional data.
/05Templates
Every template is a real Power BI project, built page by page with a before / after. New ones are released one at a time.
Boutique performance for a fashion or leather-goods house.
City operations: demand, drivers, service quality and zones.
Audience, top content and subscriptions for a streaming platform.
P&L, actual vs budget, cash and receivables for SME finance teams.
Online sales, conversion funnel, products and returns.
Headcount, hiring and leavers, absenteeism and pay equity.
Price map, price per m² and transaction volumes from open data.
Occupancy, revenue, booking channels and guest satisfaction.
Hospital activity, emergency department, beds and quality.
Production mix, consumption, CO₂ emissions and power prices.
Stock, orders and deliveries, carriers and warehouses.
Season results, player performance, ticketing and revenue.
Registrations, sales by model and powertrain, dealerships, after-sales.
Sales per restaurant, products, peak hours, food and labour costs.
Paid campaigns, social media, SEO and website traffic.
Population, budget, public services and environment for local authorities.
/06What I can help with
A clear, prioritised review of an existing report: what slows readers down, what to fix first, and what it should look like.
Within 1 weekWhat you get
I rebuild the report around the decisions it should drive: layout, navigation, KPIs that tell you if things are going well.
2 – 4 weeksWhat you get
A clean, fast model your team understands, so the report stays right after I leave.
On demandWhat you get
/07How it works
30 minutes to understand who reads the report and which decisions it should drive.
A clickable before / after of your main page, validated before anything is built.
Native Power BI: theme, background, visuals and measures, page by page.
Your team gets the .pbip project, the theme and a build guide, plus a walkthrough.
Download a free template, or tell me about the report you'd like to glow up.
Browse the free templates/08FAQ
No. Everything is built with native Power BI features available in Power BI Desktop; you only need the licences you already use to share reports.
Yes. No custom visuals and no hidden code: you receive the project, the theme and a build guide.
Yes. Most projects start from an existing report; the data model is reviewed only if it slows the report down.
Yes, all three.
It depends on the number of pages and the state of the model. After the discovery call you get a fixed-price proposal.
/09Contact
Tell me what your report is for and what isn't working. I reply within 48 hours.